資訊服務集團公司
簡介
本頁面提供了有關 Kucinski Thomas S. 已知的內部交易歷史的全面分析。內部人士包括公司的高管、董事或重要投資者。一般而言,基於內幕、非公開信息進行交易是非法的。這並不意味著他們在自己的公司進行任何交易都是非法的。但是,他們必須透過Form 4向美國證券交易委員會(SEC)報告所有交易。盡管存在這些限制,學術研究表明,內部人士 - 整體而言 - 在自己公司中的投資表現往往優於市場。
平均交易盈利能力
「平均交易盈利能力」衡量了內部人士在過去三年中所有非計劃性的公開市場購買交易的平均回報率。計算過程包括檢查每筆交易,排除了作為10b5-1交易計劃的一部分的交易。然後,對每筆交易在3、6和12個月的表現進行平均,以生成該筆交易最終的表現指標。最終,將所有交易的表現指標進行平均,計算出內部人士的總體平均表現指標。列表僅包含在過去兩年中進行過至少三筆交易的內部人士。
如果內部人士的交易盈利能力顯示為"N/A",則可能是因為該內部人士在過去三年內沒有進行任何公開市場購買交易,或者他們進行的交易距離現在太近,無法計算出可靠的表現指標。
更新頻率:每日
報告內部持倉的公司
SEC文件顯示Kucinski Thomas S.已報告在以下公司擁有持倉或進行了交易:
| 證券 | 職位 | 最新報告的持倉 |
|---|---|---|
| US:III / Information Services Group, Inc. | EVP, CHIEF HR | 333,017 |
如何解讀這些圖表
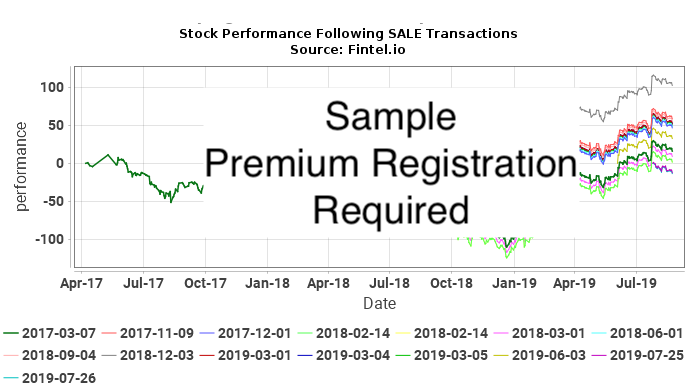
以下圖表顯示了在Kucinski Thomas S.進行的每筆公開市場非計劃交易後證券的股價表現。非計劃交易是指沒有作為10b5-1交易計劃的一部分而進行的交易。股價表現以累積百分比變化的方式繪製。例如,如果一筆內部人士交易是在2019年1月1日進行的,該圖表將顯示該證券的每日百分比變化直至當前日期。如果在此期間股價從10美元漲至15美元,則股價的累積百分比變化將為50%。從10美元漲至20美元的價格變化將為100%,而從10美元跌至5美元的價格變化將為-50%。
最終,我們將評估內部人士的交易與股價的超額回報(正向或負向)之間的相關性,以判斷內部人士是否在交易中利用內部信息獲利。如果內部人士有這樣的行為,我們預期看到(a)購買後的正回報,或者(b)賣出後的負回報。對於情況(a),購買圖表將顯示一系列向上傾斜的曲線,表示每次購買後都有正回報。對於情況(b),賣出圖表將顯示一系列向下傾斜的曲線,表示每次賣出後都有負回報。
然而,僅憑這一點還不足以得出結論。例如,如果公司的股價在多年內呈現非周期性上升,我們會預期所有購買後的圖表都呈現向上傾斜。同樣地,多年來呈現非周期性下降的股價會導致賣出後的圖表也呈現向下傾斜。這兩種情況的圖表都不能表示內部人士在進行內幕交易。
最有力的指標是在公司股價呈極度循環波動的情況下,「購買」圖表顯示正向信號,而「賣出」圖表顯示負向趨勢。這種情況強烈暗示內部人士可能根據內幕信息精確地計時進行交易,以獲得財務優勢。
III / Information Services Group, Inc.內部人士買入 - 短期收益分析
在這一部分,我們分析了在 III / Information Services Group, Inc. 中進行的每筆非計劃的公開市場內部人士購買的盈利情況。這種分析有助於了解內部人士是否持續產生異常的回報,以及是否值得跟踪。該分析基於每筆交易後一年的情況,結果僅為理論值。
以下表格顯示了最近的自動交易計劃之外的公開市場購買。
經調整價格 已按拆股調整。經調整股數 已按拆股調整。
III / Information Services Group, Inc.內部人士賣出 - 短期虧損分析
在這一部分,我們分析了在 III / Information Services Group, Inc. 中進行的每筆非計劃的公開市場內部人士賣出所達成的短期虧損規避。如果存在持續的虧損規避模式,可能表明未來的內部人士賣出交易預示著價格的下跌。該分析基於每筆交易後一年的情況,
以下表格顯示了最近的自動交易計劃之外的公開市場購買。
經調整價格 已按拆股調整。經調整股數 已按拆股調整。
歷史內部人交易
該表格顯示了由 Kucinski Thomas S. 進行的所有內幕交易的完整列表,這些交易已向美國證券交易委員會(SEC)披露。
| 呈報日期 | 交易日期 | 表格 | 證券代碼 | 證券 | 代碼 | 股份 | 剩餘股份 | % 變化 |
每股 股價 |
交易 金額 |
剩餘 金額 |
|
|---|---|---|---|---|---|---|---|---|---|---|---|---|
| 2026-06-03 |
|
4 | III |
Information Services Group Inc.
Shares of Common Stock |
F - Taxes | -12,419 | 333,017 | -3.60 | 4.51 | -56,010 | 1,501,907 | |
| 2026-04-03 |
|
4 | III |
Information Services Group Inc.
Shares of Common Stock |
A - Award | 29,297 | 345,436 | 9.27 | 3.84 | 112,500 | 1,326,474 | |
| 2026-03-19 |
|
4 | III |
Information Services Group Inc.
Shares of Common Stock |
F - Taxes | -11,022 | 315,886 | -3.37 | 4.01 | -44,198 | 1,266,703 | |
| 2026-03-17 |
|
4 | III |
Information Services Group Inc.
Shares of Common Stock |
A - Award | 7,463 | 326,908 | 2.34 | 4.02 | 30,001 | 1,314,170 | |
| 2025-06-04 |
|
4 | III |
Information Services Group Inc.
Shares of Common Stock |
A - Award | 23,292 | 318,905 | 7.88 | 4.83 | 112,500 | 1,540,311 | |
| 2025-06-04 |
|
4 | III |
Information Services Group Inc.
Shares of Common Stock |
F - Taxes | -11,561 | 295,365 | -3.77 | 4.72 | -54,568 | 1,394,123 | |
| 2025-03-18 |
|
4 | III |
Information Services Group Inc.
Shares of Common Stock |
A - Award | 18,571 | 306,926 | 6.44 | 3.50 | 64,998 | 1,074,241 | |
| 2025-03-18 |
|
4 | III |
Information Services Group Inc.
Shares of Common Stock |
F - Taxes | -8,793 | 287,828 | -2.96 | 3.36 | -29,544 | 967,102 | |
| 2024-09-04 |
|
4 | III |
Information Services Group Inc.
Shares of Common Stock |
F - Taxes | -4,944 | 296,621 | -1.64 | 3.50 | -17,304 | 1,038,174 | |
| 2024-06-04 |
|
4 | III |
Information Services Group Inc.
Shares of Common Stock |
A - Award | 35,714 | 301,301 | 13.45 | 3.15 | 112,499 | 949,098 | |
| 2024-06-04 |
|
4 | III |
Information Services Group Inc.
Shares of Common Stock |
F - Taxes | -6,922 | 265,587 | -2.54 | 3.19 | -22,081 | 847,223 | |
| 2024-04-03 |
|
4 | III |
Information Services Group Inc.
Shares of Common Stock |
F - Taxes | -3,129 | 272,509 | -1.14 | 3.99 | -12,485 | 1,087,311 | |
| 2024-03-19 |
|
4 | III |
Information Services Group Inc.
Shares of Common Stock |
A - Award | 14,815 | 275,397 | 5.69 | 4.05 | 60,001 | 1,115,358 | |
| 2023-09-06 |
|
4 | III |
Information Services Group Inc.
Shares of Common Stock |
F - Taxes | -4,944 | 260,154 | -1.86 | 5.09 | -25,165 | 1,324,184 | |
| 2023-08-02 |
|
4 | III |
Information Services Group Inc.
Shares of Common Stock |
F - Taxes | -3,740 | 265,098 | -1.39 | 5.16 | -19,298 | 1,367,906 | |
| 2023-06-05 |
|
4 | III |
Information Services Group Inc.
Shares of Common Stock |
F - Taxes | -4,230 | 268,656 | -1.55 | 5.06 | -21,404 | 1,359,399 | |
| 2023-06-05 |
|
4 | III |
Information Services Group Inc.
Shares of Common Stock |
A - Award | 18,528 | 272,886 | 7.28 | 5.06 | 93,752 | 1,380,803 | |
| 2023-04-05 |
|
4 | III |
Information Services Group Inc.
Shares of Common Stock |
F - Taxes | -2,918 | 254,358 | -1.13 | 5.10 | -14,882 | 1,297,226 | |
| 2023-04-05 |
|
4 | III |
Information Services Group Inc.
Shares of Common Stock |
A - Award | 5,271 | 257,276 | 2.09 | 5.10 | 26,882 | 1,312,108 | |
| 2022-09-06 |
|
4 | III |
Information Services Group Inc.
Shares of Common Stock |
F - Taxes | -4,754 | 251,398 | -1.86 | 5.69 | -27,050 | 1,430,455 | |
| 2022-08-03 |
|
4 | III |
Information Services Group Inc.
Shares of Common Stock |
F - Taxes | -3,596 | 256,152 | -1.38 | 7.54 | -27,114 | 1,931,386 | |
| 2022-08-03 |
|
4 | III |
Information Services Group Inc.
Shares of Common Stock |
F - Taxes | -3,193 | 259,604 | -1.22 | 7.54 | -24,075 | 1,957,414 | |
| 2022-06-03 |
|
4 | III |
Information Services Group Inc.
Shares of Common Stock |
F - Taxes | -2,170 | 262,797 | -0.82 | 6.62 | -14,365 | 1,739,716 | |
| 2022-06-03 |
|
4 | III |
Information Services Group Inc.
Shares of Common Stock |
A - Award | 14,350 | 264,967 | 5.73 | 6.62 | 94,997 | 1,754,082 | |
| 2022-04-05 |
|
4 | III |
Information Services Group Inc.
Shares of Common Stock |
A - Award | 5,095 | 250,617 | 2.08 | 6.87 | 35,003 | 1,721,739 | |
| 2021-09-03 |
|
4 | III |
Information Services Group Inc.
Shares of Common Stock |
F - Taxes | -4,754 | 245,146 | -1.90 | 7.07 | -33,611 | 1,733,182 | |
| 2021-08-12 |
|
4 | III |
Information Services Group Inc.
Performance Based RSUs |
M - Exercise | 9,225 | 0 | -100.00 | ||||
| 2021-08-12 |
|
4 | III |
Information Services Group Inc.
Shares of Common Stock |
F - Taxes | -4,795 | 249,900 | -1.88 | 6.57 | -31,503 | 1,641,843 | |
| 2021-08-12 |
|
4 | III |
Information Services Group Inc.
Shares of Common Stock |
M - Exercise | 9,225 | 254,695 | 3.76 | ||||
| 2021-08-03 |
|
4 | III |
Information Services Group Inc.
Shares of Common Stock |
F - Taxes | -6,789 | 245,470 | -2.69 | 5.97 | -40,530 | 1,465,456 | |
| 2021-06-03 |
|
4 | III |
Information Services Group Inc.
Shares of Common Stock |
A - Award | 16,949 | 252,105 | 7.21 | 5.90 | 99,999 | 1,487,420 | |
| 2021-06-03 |
|
4 | III |
Information Services Group Inc.
Shares of Common Stock |
F - Taxes | -3,341 | 235,156 | -1.40 | 5.90 | -19,712 | 1,387,420 | |
| 2021-05-21 |
|
4 | III |
Information Services Group Inc.
Performance Based RSUs |
M - Exercise | 12,195 | 0 | -100.00 | ||||
| 2021-05-21 |
|
4 | III |
Information Services Group Inc.
Shares of Common Stock |
F - Taxes | -6,338 | 238,497 | -2.59 | 5.58 | -35,366 | 1,330,813 | |
| 2021-05-04 |
|
4 | III |
Information Services Group Inc.
Shares of Common Stock |
F - Taxes | -12,832 | 232,640 | -5.23 | 4.55 | -58,386 | 1,058,512 | |
| 2020-09-03 |
|
4 | III |
Information Services Group Inc.
Performance-based RSUs |
A - Award | 12,195 | 12,195 | |||||
| 2020-09-03 |
|
4 | III |
Information Services Group Inc.
Shares of Common Stock |
A - Award | 36,585 | 244,660 | 17.58 | ||||
| 2020-08-04 |
|
4 | III |
Information Services Group Inc.
Shares of Common Stock |
F - Taxes | -6,788 | 208,075 | -3.16 | 2.05 | -13,915 | 426,554 | |
| 2020-06-02 |
|
4 | III |
Information Services Group Inc.
Shares of Common Stock |
F - Taxes | -3,283 | 214,540 | -1.51 | 1.79 | -5,877 | 384,027 | |
| 2020-05-05 |
|
4 | III |
Information Services Group Inc.
Shares of Common Stock |
A - Award | 24,691 | 217,823 | 12.78 | 2.43 | 59,999 | 529,310 | |
| 2020-04-03 |
|
4 | III |
Information Services Group Inc.
Shares of Common Stock |
F - Taxes | -10,173 | 193,132 | -5.00 | 2.15 | -21,872 | 415,234 | |
| 2020-03-17 |
|
4 | III |
Information Services Group Inc.
Shares of Common Stock |
P - Purchase | 5,500 | 202,981 | 2.79 | 1.80 | 9,900 | 365,366 | |
| 2019-08-08 |
|
4 | III |
Information Services Group Inc.
Shares of Common Stock |
S - Sale | -2,072 | 196,817 | -1.04 | 2.26 | -4,683 | 444,806 | |
| 2019-08-05 |
|
4 | III |
Information Services Group Inc.
Shares of Common Stock |
S - Sale | -1,607 | 198,889 | -0.80 | 2.64 | -4,242 | 525,067 | |
| 2019-08-05 |
|
4 | III |
Information Services Group Inc.
Performance-based RSUs |
A - Award | 9,225 | 9,225 | |||||
| 2019-08-05 |
|
4 | III |
Information Services Group Inc.
Shares of Common Stock |
A - Award | 27,675 | 200,496 | 16.01 | ||||
| 2019-06-04 |
|
4 | III |
Information Services Group Inc.
Shares of Common Stock |
S - Sale | -3,547 | 172,557 | -2.01 | 3.02 | -10,712 | 521,122 | |
| 2019-04-03 |
|
4 | III |
Information Services Group Inc.
Shares of Common Stock |
A - Award | 17,763 | 176,104 | 11.22 | ||||
| 2019-04-03 |
|
4 | III |
Information Services Group Inc.
Shares of Common Stock |
F - Taxes | -1,040 | 158,341 | -0.65 | 3.80 | -3,952 | 601,696 | |
| 2019-03-19 |
|
4 | III |
Information Services Group Inc.
Shares of Common Stock |
F - Taxes | -6,776 | 159,157 | -4.08 | 3.60 | -24,394 | 572,965 | |
| 2019-02-05 |
|
4 | III |
Information Services Group Inc.
Shares of Common Stock |
F - Taxes | -13,444 | 165,933 | -7.49 | 4.16 | -55,927 | 690,281 | |
| 2018-08-02 |
|
4 | III |
Information Services Group Inc.
Shares of Common Stock |
A - Award | 24,570 | 179,007 | 15.91 | ||||
| 2018-06-04 |
|
4 | III |
Information Services Group Inc.
Shares of Common Stock |
F - Taxes | -2,773 | 154,233 | -1.77 | 3.91 | -10,842 | 603,051 | |
| 2018-04-04 |
|
4 | III |
Information Services Group Inc.
Shares of Common Stock |
F - Taxes | -2,895 | 157,006 | -1.81 | 4.18 | -12,101 | 656,285 | |
| 2018-03-16 |
|
4 | III |
Information Services Group Inc.
Shares of Common Stock |
A - Award | 13,235 | 159,702 | 9.04 | ||||
| 2018-02-05 |
|
4 | III |
Information Services Group Inc.
Shares of Common Stock |
A - Award | 23,474 | 146,467 | 19.09 | ||||
| 2017-11-15 |
|
4 | III |
Information Services Group Inc.
Shares of Common Stock |
P - Purchase | 5,794 | 122,586 | 4.96 | 3.91 | 22,655 | 479,311 | |
| 2017-09-12 |
|
4 | III |
Information Services Group Inc.
Shares of Common Stock |
P - Purchase | 6,100 | 116,792 | 5.51 | 3.71 | 22,631 | 433,298 | |
| 2017-08-21 |
|
4 | III |
Information Services Group Inc.
Shares of Common Stock |
P - Purchase | 4,900 | 110,692 | 4.63 | 3.65 | 17,885 | 404,026 | |
| 2017-08-21 |
|
4 | III |
Information Services Group Inc.
Shares of Common Stock |
P - Purchase | 10,100 | 105,792 | 10.55 | 3.65 | 36,865 | 386,141 | |
| 2017-06-08 | 3 | III |
Information Services Group Inc.
Shares of Common Stock |
156,775 | ||||||||
| 2017-06-08 | 3 | III |
Information Services Group Inc.
Shares of Common Stock |
99,040 | ||||||||
| 2017-06-08 | 3 | III |
Information Services Group Inc.
Shares of Common Stock |
99,174 | ||||||||
| 2017-06-08 | 3 | III |
Information Services Group Inc.
Shares of Common Stock |
120,881 | ||||||||
| 2017-06-08 | 3 | III |
Information Services Group Inc.
Shares of Common Stock |
156,775 | ||||||||
| 2017-06-08 | 3 | III |
Information Services Group Inc.
Shares of Common Stock |
99,040 | ||||||||
| 2017-06-08 | 3 | III |
Information Services Group Inc.
Shares of Common Stock |
99,174 | ||||||||
| 2017-06-08 | 3 | III |
Information Services Group Inc.
Shares of Common Stock |
120,881 |
P
非衍生或衍生證券的公開市場或私下買入
S
非衍生或衍生證券的公開市場或私下賣出
A
公司向內部人員授予、獎勵或以其他方式獲取證券(例如股票期權)
C
衍生工具轉換
D
將證券賣出或轉讓回公司
F
使用從公司收到的證券的一部分來支付行使價或稅務負擔。
G
內部人士贈送或接收他人贈送公司股票
K
股權掉期和類似的避險交易
M
行使或轉換從公司獲得的衍生證券(例如期權)
V
內部人士透過Form 4自願報告的一筆交易
J
其他(附有交易描述的腳註)